Why Visual Programming and Testing Are the Next Step

You've written a neat little script. Sixty lines, maybe seventy. It loads some data, runs a few transformations, trains a model, and spits out a result. Clean. Simple. Done.
Except it isn't simple. Not really.
What 60 Lines Are Actually Doing
Here's the thing about data science code: it doesn't read like a novel. It reads like a conversation happening in five different rooms at once. A dataframe created on line 12 might not be touched again until line 58. A feature engineered on line 30 quietly feeds into a join on line 47, which itself depends on a filter defined way back on line 15. The logic isn't linear, even if the script is.
And that's just one script. In most real pipelines, you're dealing with multiple scripts, shared datasets, and transformations that ripple across files in ways that aren't obvious from reading the code top to bottom.
This is what we call the interplay between data and code, and it's where hidden complexity lives. Your code executes sequentially, but the relationships between your data objects don't follow that order. They form a network: branching, merging, looping back. The script might be 60 lines, but the logical structure underneath could be far more tangled than it appears.
Why Reading the Code Isn't Enough
As data scientists, we tend to trust our ability to hold the pipeline in our heads. And for a while, that works. But the moment you step away for a week, hand the work to a colleague, or need to explain your process to a compliance team, the gaps become obvious.
You can't see the dependency between line 20 and line 60 just by scanning the code. You can't easily spot that a single data transformation feeds three downstream outputs. And you definitely can't explain the logical flow to a non-technical stakeholder by showing them a Python script.
This isn't a failure of skill. It's a limitation of the medium. Code is a set of instructions. What's missing is a way to see how those instructions actually interact with your data, and that requires a different kind of representation entirely.
Seeing the Network, Not Just the Script
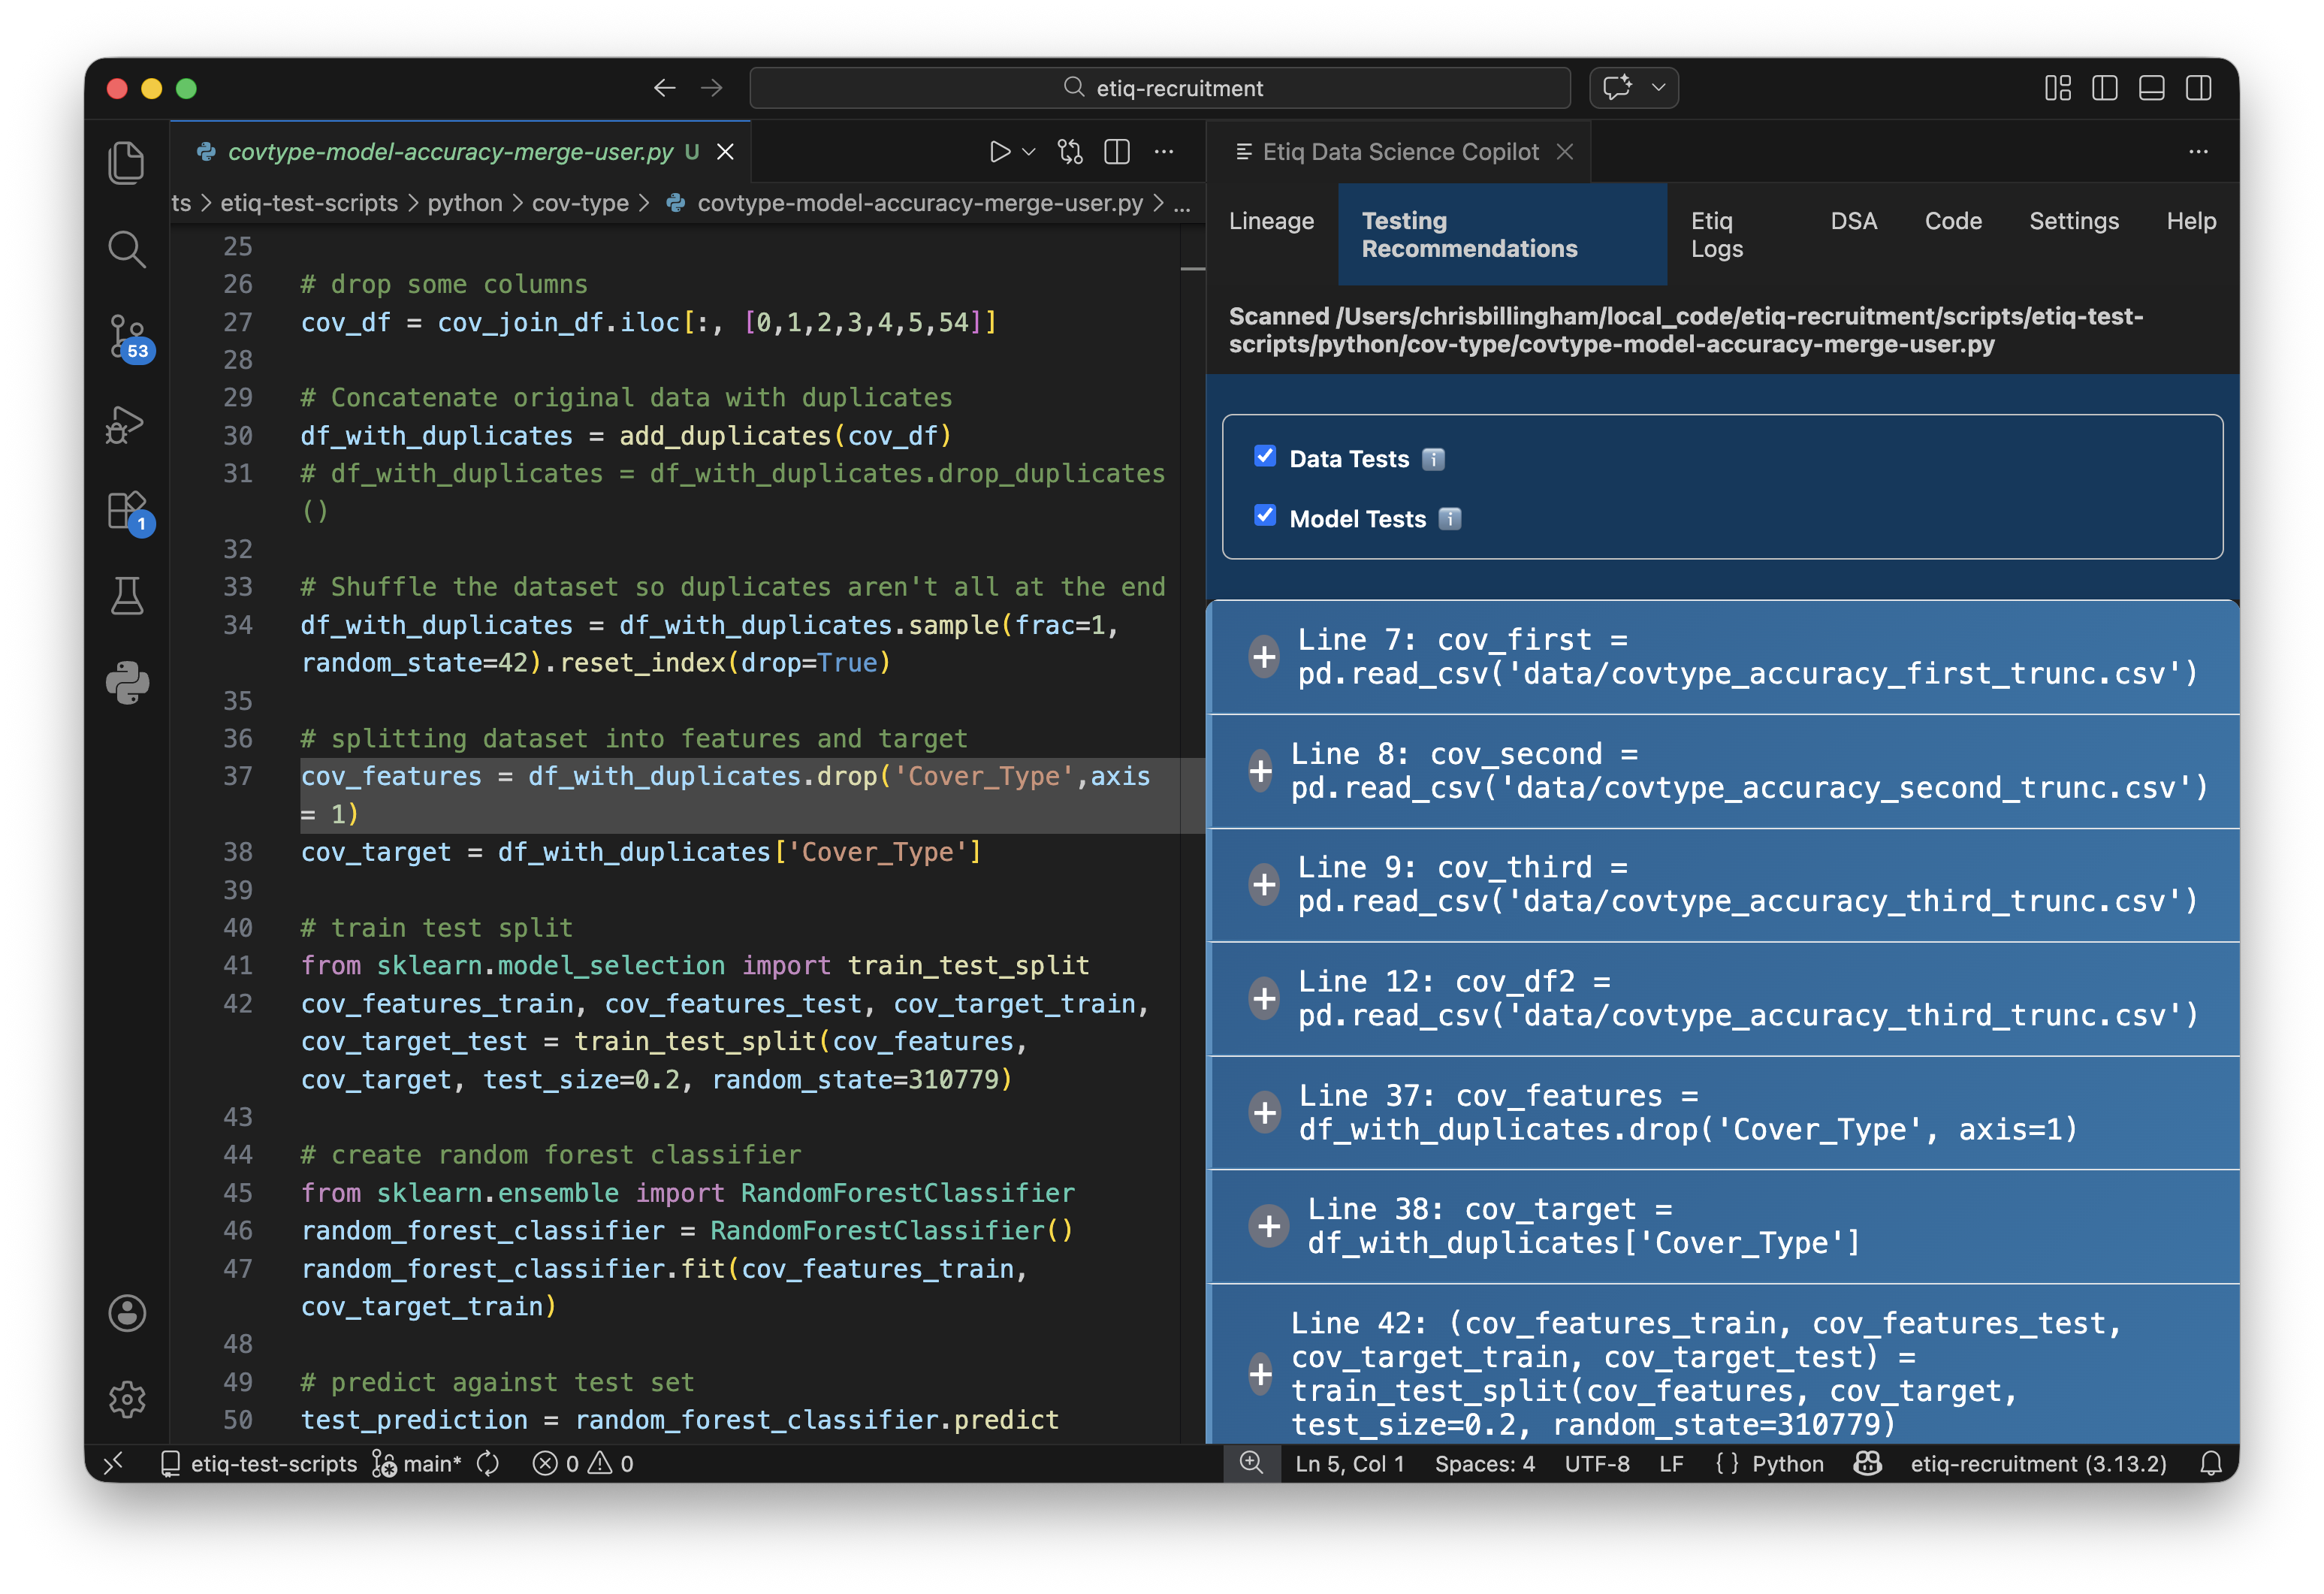
This is why we built Lineage as part of Etiq's Data Science Copilot. Lineage takes your script and visualises the interplay between your data and your code as a network diagram, directly in your IDE. Data objects become nodes. Functions and transformations become connections. And suddenly, that hidden complexity isn't hidden anymore.
You can trace a single data table through your entire pipeline: where it was created, what transformed it, where its outputs end up, and how it connects to everything else. Those non-linear relationships that were invisible in the code are now laid out clearly in front of you.
It doesn't matter whether you're building something new or inheriting someone else's work. Lineage works with what you already have, analysing your scripts without requiring you to change how you code.
Testing What You Can Now See
Visibility is only half the picture. Once you can see the complexity in your pipeline, the next question is: how do you verify it? How do you know that the data flowing through those connections is behaving the way you expect?
That's where targeted testing comes in. When you can see your pipeline as a network, you can identify exactly where to place tests, at the critical junctures where data transforms, merges, or feeds into model training. You're not guessing what to test anymore; you're testing what matters, precisely where it matters.
Etiq's Testing Recommendations work alongside Lineage for exactly this reason. Once you can see the structure, our copilot recommends the right tests for the specific points in your pipeline that carry the most risk, and lets you run them with a single click.
Complexity Isn't the Enemy. Invisibility Is.
A 60-line script can hide a surprising amount of complexity, and that's fine. Data science pipelines are complex because the problems they solve are complex. The issue isn't the complexity itself. It's not being able to see it, verify it, and communicate it.
When you can visualise the network your code creates and test the data flowing through it, you move from hoping your pipeline works to knowing it does. And that's a very different place to be on a Friday afternoon.